heading
Service quality regulationSQ2DEstablish processes to validate the data provided by operators
In addition to audit verification of collected data, regulators validate the data through benchmarking. Since this action puts additional burdens on the monitoring process, establishing protocols regarding their sequence within the process can save time and financial resources. In accordance, regulators usually conduct annual benchmarking in which they validate operator performance by comparing and analyzing data collected through audits. This exercise could be structured around different categories of performance indicators, such as indicators aimed at protecting consumer interests, the sustainability of operators, and environmental sustainability.
Expected Outcomes
• There is a reliable and transparent data validation process.
• Service operators’ internal structure is aligned with the data validation process.
• Consumer interests are adequately protected.

Examples
Portugal
In Portugal, the Water and Wastewater Regulation Authority (ERSAR) has established a methodology in the service quality assessment process that involves a sequence of stages to create a clear, rational, and transparent system. The procedures include a process in which information is first provided by the operators, then validated and audited to verify data reliability by a regulator. The extensive and complex procedure can be found in the link below
Ecuador
The Water Regulation and Monitoring Agency (ARCA) defines technical standards for the assessment and diagnosis of public drinking water and/or sanitation utilities in urban and rural areas on Ecuadorian territory, which regulate parameters and indicators for such assessments and diagnoses.
Using the information reported by providers, ARCA provides benchmarking for water forecasting and planning studies in the specific area in which the public utilities are provided, so that the municipalities in charge of such provision can ensure adequate company management upholding the principles of service transparency, efficiency, sustainability and quality improvement.
For this exercise, ARCA established 31 indicators classified into 7 categories, namely:
- Access to the service
- Cost efficiency
- Financial balance
- Commercial efficiency
- Compliance
- Corporate responsibility
- General state of infrastructure
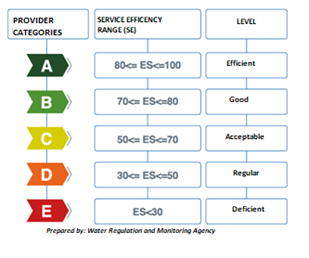
The results of indicators and their categories are then weighted to establish the DRINKING WATER AND SANITATION EFFICIENCY LEVEL RATE (INES), with a value between 0% and 100%. Lastly, benchmarking results are used to categorize providers as follows:
Colombia
The Regulatory Committee on Drinking Water and Basic Sanitation (CRA), Colombia’s regulator, is in charge of defining mandatory criteria, methodologies, indicators, parameters and models for assessing the management and results of legal entities that provide public aqueduct and sewerage services for households, as well as establishing the methodology for their classification according to risk level, characteristics and conditions, with the aim of determining which providers require an inspection and special or detailed supervision by the Superintendency of Public Services, the body responsible for supervision and monitoring.
Based on the information reported by providers, the CRA defines a benchmarking methodology for assessing management and determining service provision risk levels for each provider.
For this methodology, the CRA established a series of indicators classified into 8 dimensions:
- Service quality
- Efficiency of investment planning and management
- Operational efficiency
- Corporate management efficiency
- Financial sustainability
- Governance and transparency
- Environmental sustainability
- Tariff management
The results of the indicators and their dimensions are weighted to establish the UNIQUE SECTOR INDICATOR (IUS) with a value between 0 and 100. Benchmarking results are used to categorize providers as follows:
| IUS Result | Risk Level Classification |
| 0 ≤ IUS ≤ 30 | High Risk |
| 30 < IUS ≤ 60 | Medium-High Risk |
| 60 < IUS ≤ 80 | Medium Risk |
| 80 < IUS ≤ 90 | Medium-Low Risk |
| 90 < IUS ≤ 100 | Low Risk |
Links
Portugal: Portugal regulator ERSAR Water and Wastewater Services Quality Assessment Guide:
Ecuador. BENCHMARKING OF DRINKING WATER AND SANITATION SERVICE PROVIDERS IN ECUADOR. Statistics Bulletin 2020
Colombia. CRA Resolution 943 of 2021. Article 1.6.5.1.2:
https://normas.cra.gov.co/gestor/docs/resolucion_cra_0943_2021.htm#1.6.5.1
Internal capacities needed and the role of partners
Abilities required to conduct this action include statistical, hydrological, and administrative skills. Validation exercises, being an internal regulatory process, would benefit from the experience of other regulators. To that end, technical regional exchanges could be valuable in aiding improvement. Options for other partners who could be involved include national statistical institutions, the private sector, and research institutions. Regulator staff must also be trained on how to benchmark and how to regulate service quality.